

Today, we are blessed with a wealth of gaming data if you know where to look. The release of the American Gaming Association’s “2026 State of the States” last month is just one example. But it wasn’t always that way.
“Just the facts, ma’am.” For those born after the Baby Boom (I’m guessing that’s most of you), “Dragnet” was once the hottest show on television. It featured LAPD detectives in the 1950s. Think “Law & Order,” but in black & white. Sergeant Joe Friday, played by Jack Webb, could barely get through an interview with any female witness without delivering that famous line.
Back then, facts weren’t easy to come by. Even for the cops. There were no NCIC1 checks, no FBI fingerprint databases, and no DNA swabs. Despite video of everything today, when George Orwell wrote about the surveillance state of “1984” (written in 1949), the only cameras anywhere had flashbulbs attached. Even so, 1950s & ‘60s law enforcement was light years ahead of gaming when it came to accessible data.

Case in point: when the Las Vegas exposé “The Green Felt Jungle” was published in 1963, it hit like a bombshell. While legislators and much of the public was shocked by all the lurid corruption allegations, most of the book was not factual, but mostly fictional fabrications. That was somewhat surprising since one of the co-authors was Pulitzer Prize-winning newspaperman Ed Reid (see our 2024 review).
The only completely fact-based revelation was buried in its appendix. It listed the actual owners of the Las Vegas casinos, their addresses, and their percentage of controlling interests. The data was from Nevada Gaming Control Board records. Neighbors, politicians, and law enforcement were stunned to discover the guy next door was probably mobbed up. Even though that data existed, getting to it was difficult. Facts, and (importantly) access to them, matter.
In those “Dragnet” days, your research sources were limited to the library, City Directory, phone book, gossipy pit bosses or anyone who could afford an Encyclopedia Britannica. Today nearly everything is online. But with that ease of access, it demands even more care, not less, about conclusions and comparisons.
Here’s an example:
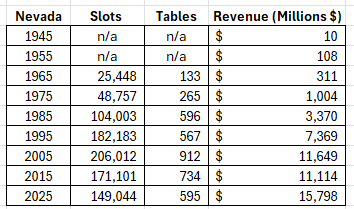
Source: UNLV and Journal of Gaming Studies
Nevada’s slots and tables seemed to peak in 2005, yet 20 years later revenues were higher with fewer games. That is great news about product efficiency and smart marketing. Right?
But now run those numbers through the BLS CPI2 Inflation Calculator. That $11.6 billion in 2005 equals $19.2 billion today. Suddenly Nevada didn’t grow. It actually declined 17.7%! Before you decide to update your résumé and change industries, gaming nationwide still remains one of the most profitable endeavors.
With apologies to Taylor Swift and Beyoncé, concert ticket sales hit just $5.8B last year (Pollstar). If you add music recording ($11.5B), the global movie box office ($33.5B), Broadway plays ($1.91B) and book publishing ($33B), they still lag way behind casino gaming. The AGA3 reported commercial casino revenues of $78.7B, and Native American operators added an estimated $43.9B (NIGC4 through July ’25) — well over $122B combined.
As for Nevada’s relative slide, consider the competition. Commercial casinos grew from 455 in 2005 to 486 today. That’s just a modest 6.8% increase. But Native American casinos jumped from 406 to 542, a 31% surge. Context changes everything.
None of this is meant to discourage research. It’s simply a reminder to be thorough and check multiple sources. As Nobel-winning economist Ronald Coase put it, “If you torture the data long enough, it will confess.” Or, in Mark Twain’s darker framing: “Lies, damned lies, and statistics.”

I still love data. In my casino management days, nothing carried more weight in a meeting than walking in with facts behind your argument. With that in mind (for the uninitiated), my go-to sources are listed below, pretty much in order. I didn’t include any click links, but you can easily find them with a simple Google or Bing search. Only Newspapers.com and some of the Las Vegas Advisor features, along with portions of Casino City, require a subscription. The rest are public:
- UNLV Center for Gaming Research — Broad national data, historical and forward-looking research studies.
- CDC Gaming — Up-to-the-minute industry news; contributor Ken Adams posts timely nationwide monthly revenue updates; searchable news and editorial archive.
- AGA / NIGC — Highly quotable, excellent for comparative annual stats, and position papers on current gaming and problem gambling issues.
- Casino City Press — Property specs; executive listings; geographical maps of nearby casinos; grab their free Casino Buyer’s Guide at trade shows for vendor contacts.
- State Gaming Control Agencies— The most current monthly revenue, tax, licensing and regulatory data, but just one jurisdiction at a time.
- Problem Gambling resources — NCPG5 Annual Reports; AGA’s “Awareness” studies and AGA’s state-by-state “Regulations & Statistics” guide.
- Convention & Visitor Bureaus — Strong demographic and travel-spending data (LVCVA for Las Vegas, RSCVA for Reno/Tahoe).
- The Internet — Abundant resource, but critical to verify everything with multiple sources. Some of the best: Pechanga.net (excellent with Native American gaming issues); Global Gaming Business (GGB); Las Vegas Advisor; The Monitor Room (fraud and cheating news); Wikipedia (generally a reliable generic source); and Newspapers.com (great for fact checking).
I’ll close with a quote from Barry Beracha, CEO of Sara Lee who summarized my feelings: “In God we trust. All others bring data.”
# # #
1 – NCIC – National Crime Information Center
2 – BLS: Bureau of Labor Statistics; CPI: Consumer Price Index
3 – AGA: American Gaming Association
4 – NIGC: National Indian Gaming Commission
5 – NCPG: National Council on Problem Gambling